The StockChart Main Program
The main program of StockChart is a relatively large Lotus 1-2-3 macro program. Support programs include a converter for stock data and several batch files to support data retrieval. Before running StockChart, you should close all open applications. StockChart takes a lot of memory. This restriction may not apply to you if you are running on a machine without BUDDY and the several other TSRs I keep on my machine. Run StockChart by starting Lotus 1-2-3, then use MENU, File, Retrieve to select StockChart. It takes about a minute to load (the WAIT indicator is displayed by Lotus during the load). When it is ready, StockChart will beep twice and display a graph of the currently loaded data. The first time you run StockChart, the current data will be for Microsoft (MSFT). The graph shown will have closing prices and daily volumes plotted for a six month range of dates. There is also a linear regression line of the price information superimposed on the data graph. (See Figure 1.) Press any key to return to the main StockChart menu.
Figure 1: StockChart initial display - Price, Volume, and Price Linear Regression.
Menu Operations
The main menu gives you choices to display other graphs, perform
analysis on the data, set a series of options, or load data for a different
stock. (See Figure 2.)
Figure 2: StockChart Main Menu
The price, volume, and combined price and volume (Both) graphs can be displayed by highlighting the menu item and pressing [ENTER] or typing the P, V, or B keys.
The Analyze Menu Operations
The Analyze menu item opens another menu which presents
several options for analysis of the stock data. (See Figure 3.)
Figure 3: Analyze Menu
Extend displays a linear regression line calculated from the last 30 days of price data and plotted for 30 days into the future (Figure 4.). If, for the next month, the stock price kept behaving as it had for the last month, the ending price would be the number shown at the far right of the graph.
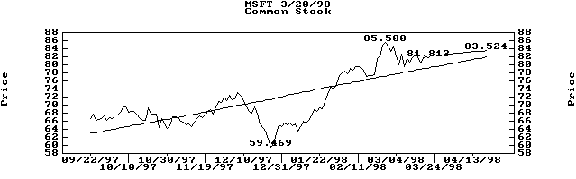
Figure 4: Graph of Extended Price Data
DeltaLR displays a graph (Figure 5) of the difference between the actual price on a given date and the linear regression line computed from all of the data. This process plots the linear regression line as 0 on the graph and the actual closing prices as a value above or below the regression line. I use this graph to quickly show whether a stocks price is getting ahead of or behind the expected price based on the entire range of data (typically six months or a year).
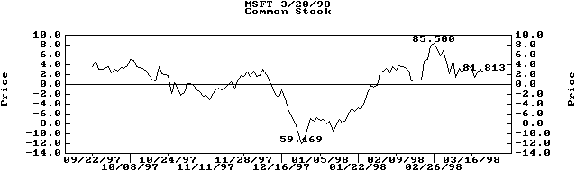
Figure 5: DeltaLR Graph
Smooth moves you to a menu to display moving averages. The Moving_Ave menu item will calculate and display a moving average. The Days=10 menu item is used to both set up and document the period over which the moving average is calculated. StockChart limits the period of the moving average to a sensible range. Basically, it allows a moving average over as small a range as two days, and as large as one fourth of the data range (45 days for a six month data range). I typically use a 10 day moving average (see Figure 6) which smoothes out the daily ripples in the stocks I follow, but still shows weekly movements quite clearly.
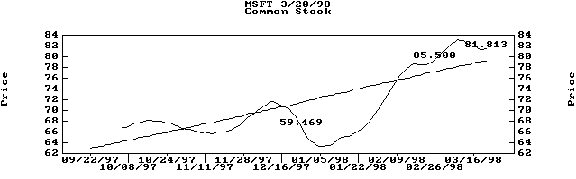
Figure 6: Smooth (Moving Average) Graph.
Find presents a menu that allows you to look at the raw data.
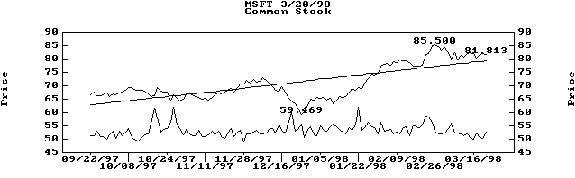
Regress presents a menu that allows you to create and display a regression line over a range of dates that you specify. This function is very useful if the stock has made an abrupt change in direction that isn't yet long enough to weight the overall data regression.
Figure 7 shows a user regression over the dates 01/01/98 to 02/20/98. This regression is superimposed on the Price graph. The user regression can be extended forward or backward or both forward and backward, depending on choices made in the Options menu. Figure 7 shows the user regression extended forward to the end of the data.
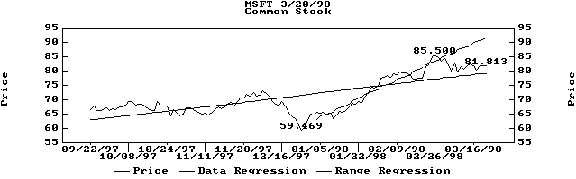
Figure 7: User regression for the dates 1/01/98 to 2/20/98
Zoom presents a menu which allows you to zoom in on a smaller range of data than the full six or twelve months. When StockChart loads a stocks data, Zoom is set to show the last 90 days of data. That chart is immediately available by selecting View in the Zoom menu. Create allows you to specify a range of dates to zoom in on and display. You can go back to the last zoomed graph at any time by selecting Zoom View. The zoomed charts will include any user regression lines which are in the zoom range.
Getting The Data
To capture the stock data, I use D&A Software, Inc.'s WWW/LX and GET software. WWW/LX provides a PPP connection from my HP 200LX to my ISP. GET is a clever freeware program from D&A Software, Inc. which will find and download information on the Web without using a Web browser. This capability means that a list of Web site data files can be downloaded automatically.
The data we need is provided by Nasdaq (http://www.nasdaq.com). When you specify a stock symbol on the Nasdaq site, you get information on the latest trade and an option to show a graph of the closing prices. If you select, for example, the six month graph, you also have the option to look at the data (date, price, volume) from which the graph is plotted. This data is what is downloaded by GET.
The downloaded data is in html format. The StockChart system includes a program called CHART.EXE which strips off the html formatting. Chart also computes information derived from the price and volume data. The overall data regression is computed, the average volume is computed, minimum, maximum, and closing prices are found and set up so that the StockChart program can quickly load and display these items without the long execution time of the Lotus macros. The 90-day zoomed data is isolated, and the minimum, maximum, and closing prices in that range are found and formatted.
I have set up StockChart using a system macro that runs at 5 AM EST every morning after a market close (Tuesday through Saturday) to retrieve and preprocess information on about fifteen Nasdaq stocks I follow. When I get up in the morning, I can look at the latest charts on those stocks while I am having my morning coffee.
Note: StockChart does not contain WWW/LX or GET. It does includes
all other programs and documentation to get up and running with StockChart.